
We all know platoon splits exist for not just hitters, but pitchers.
How do they look?
Non-Contact Outcomes
K% & BB%
Minimum 1000 pitches vs. L/R:
- Average K% diff: 3.98%
- Median K% diff: 3.30%
- Average BB% diff: 2.72%
- Median BB% diff: 2.20%
A typical pitcher would have a 3.3 K% / 2.2 BB% split between left/right-handed hitters, which is significant but does not seem extraordinary.
Correlations
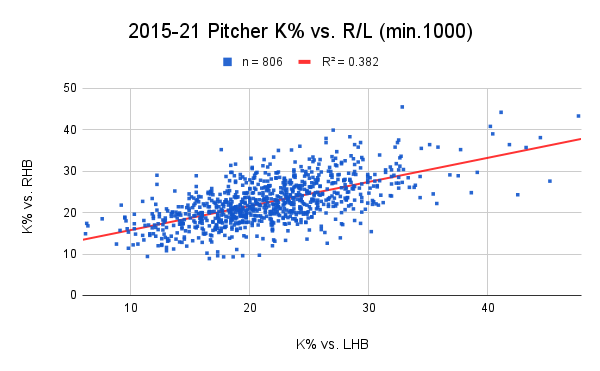
Pitchers’ strikeout ability transferred between sides; there was a significant correlation(r^2 of 0.382), although I personally was expecting a much higher correlation.
The most radical contrast came from Jordan Romano, who had one of the highest K% vs. LHB(42.5% – 5th) while having merely an average K% vs. RHB(24.3%).
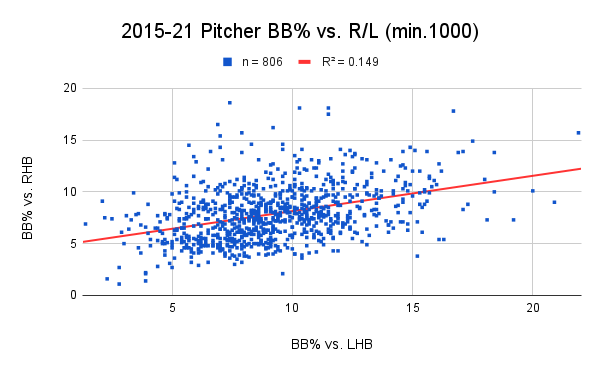
Walk rates had a weak correlation. So much so that Zac Reininger had one of the highest BB% vs. RHB(3.8% – 22nd), while one of the highest BB% vs. LHB(15.2% – 35th).
Results
- Average K-BB% diff: 5.47%
- Median K-BB% diff: 4.55%
Using median K-BB% difference, I used the kwERA equation to convert K-BB% into a potential ERA difference:
12 * 4.55% = 0.546
Meaning: a typical pitcher has a 0.55 ERA-worth of a platoon-split in performance by striking out / walking more or less.
Contact Outcomes
EV & LA
Minimum 100 BIP vs. L/R:
- Average EV diff: 1.77 mph
- Median EV diff: 1.40 mph
- Average LA diff: 3.5°
- Median EV diff: 3.0°
A typical pitcher would have a 1.4 mph / 3° split between left/right-handed hitters, which is also significant but does not seem extraordinary.
Correlations

A pitcher’s EV-against is entirely specific to the batter’s handedness.
The most radical contrast came from Gregory Soto, who had one of the lowest EV vs. LHB(83.4 mph – 19th) while having one of the highest EV vs. RHB(92.5 mph – 3rd). Correspondingly, the xwOBAcon split was 0.140.
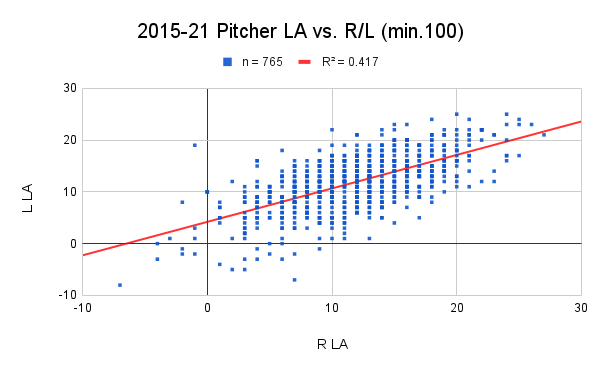
On the other hand, there was a significant correlation between LA R/L, which means that groundball/flyball pitchers are likely to be groundball/flyball pitchers against both sides of the plate.
Results
- Average xwOBAcon diff: 0.033
- Median xwOBAcon diff: 0.028
Using median xwOBAcon difference, I used the dERA equation to convert xwOBA into a potential ERA difference:
0.028 * 28.61 = 0.801
Meaning: a typical pitcher has a 0.8 ERA-worth of difference in performance just by the quality of contact allowed. Interestingly, balls in play created a bigger difference than strikeouts/walks.
A certain portion of the difference is likely due to the hitter, not the pitcher.
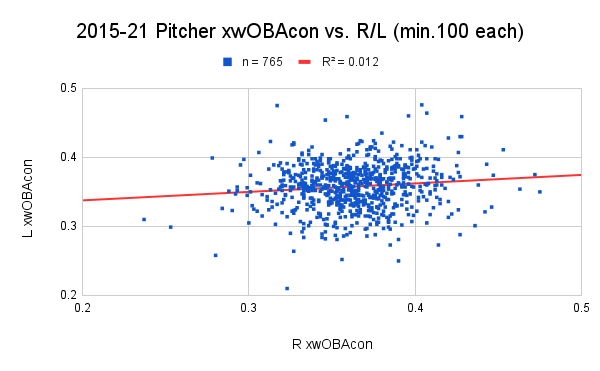
Surprise, surprise: there was little correlation between a pitcher’s ability to manage contact against LHB vs. RHB. In other words, a pitcher can be amazing at suppressing LHBs, and simultaneously be terrible at suppressing RHBs.
With xwOBAcon split, Nate Jones comes out of the page with a staggering difference of 0.158(0.475 vs. L, 0.317 vs. R).
It is something worth thinking about that the LA correlation didn’t contribute to the outcome(xwOBAcon).
Cause of Splits
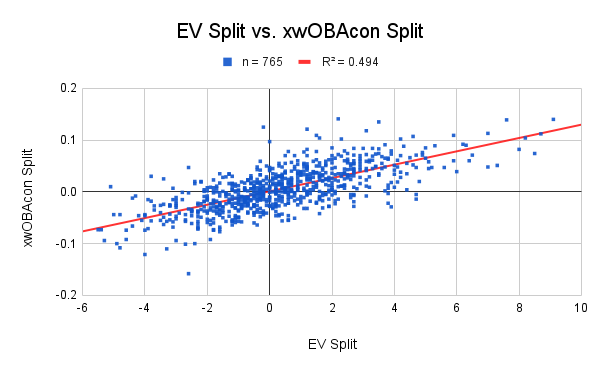
Now, close to half of the difference in xwOBAcon can be explained by EV difference; an r^2 of 0.494 is very significant. For every 2 mph, pitchers gained/lost around 0.026 points.
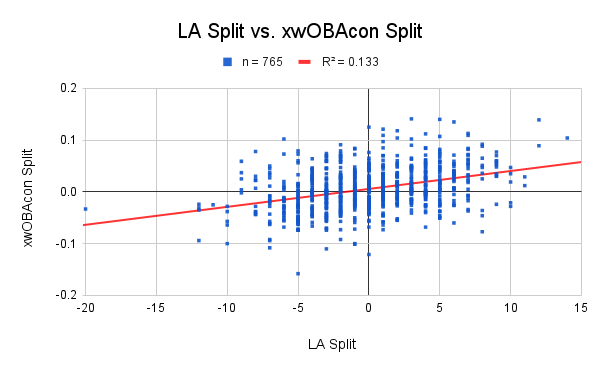
LA showed a much weaker correlation, For every 5°, pitchers gained/lost around 0.017 points.
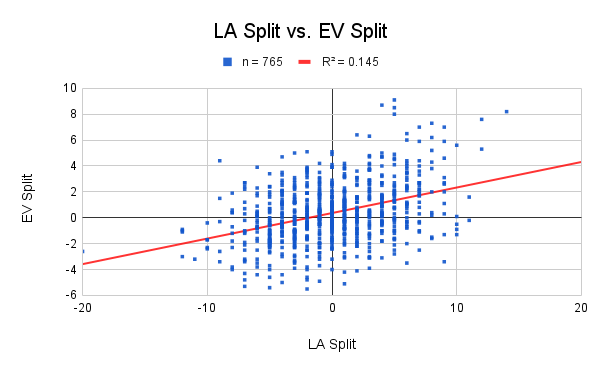
Some of the EV Split is caused by LA Split; for every 10 degrees, the average EV drops by approx. 2 mph.
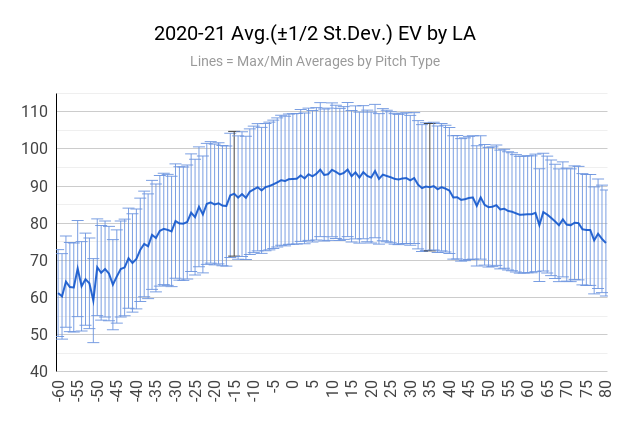
This matches with considering that the vast majority of pitchers have an average LA between 5-20°; a decrease in LA results in a much more EV decrease than an increase(about 2x).