
GAPA: Explaining K% With Depth
PitcherList’s CSW has been popularised with its simplicity & effectiveness. At the least, it takes 4 clicks at Statcast Search and is more predictive than SwSt% / more descriptive than Whiff%.
GAPA explains K%, better, with a correlation of r^2 = 0.89
GAPA is a simple & effective look into “what makes a strikeout?”
CSW / CSWF
If you haven’t read the article above, CSW is (CalledStrikes + SwingingStrikes) / Total Pitches, or CalledStrike% + SwStr%.
CSW stands for Called Strikes + Whiffs, in this case, whiff is used as a synonym for a swinging strike.
It correlates well with K%:
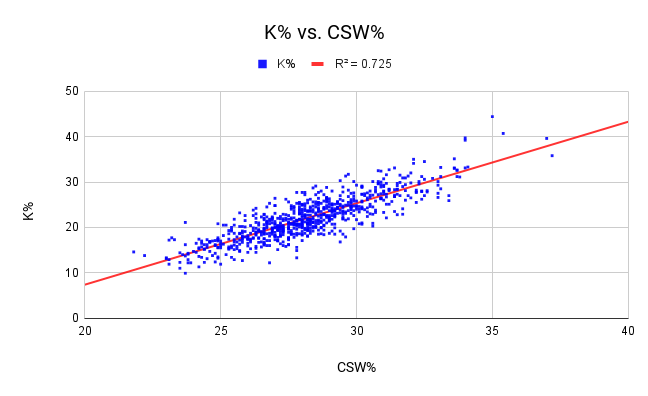
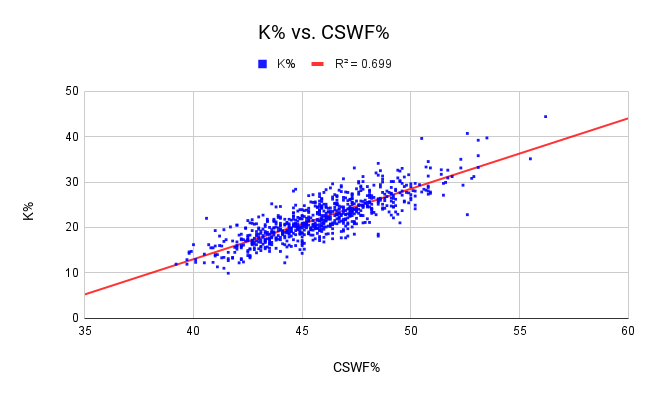
CSW doesn’t include fouls, as CSWF performs worse(r^2 of 0.699) than CSW(r^2 of 0.725). Hence, it was dismissed as being unpredictable/noisy.
The actual reason looks to be that fouls don’t result in the third strike; with 2 strikes, a foul is a negative.
In the meanwhile, fouls are positive with <2 strikes as they progress the count.
Let’s take those into account.
GAPA = GoAhead% + PutAway%
PutAway% is CSW with 2 strikes. It was introduced last year with better performance(r^2 of 0.783).
GoAhead% is CSWF with <2 strikes.
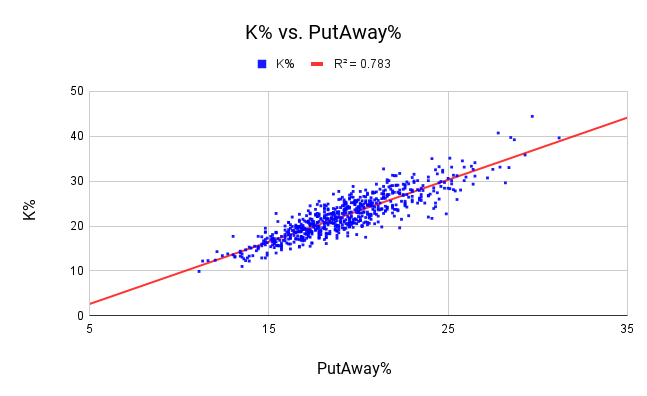
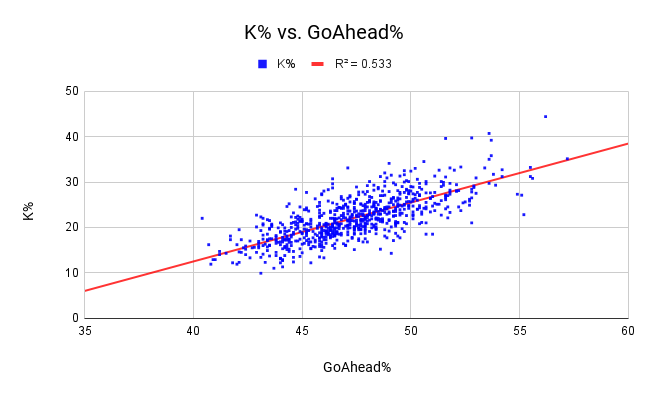
On their own, they’re not too impressive.
Au contraire:
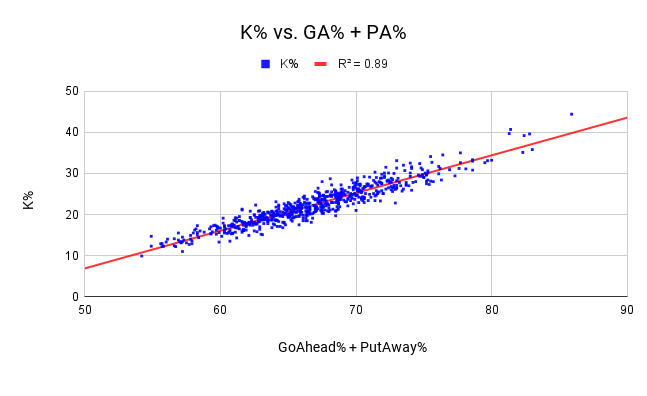
GAPA posts an impressive r^2 of 0.89, essentially leaving out only specific count-leverages(perhaps something else).
Indeed, it takes a bit more work than CSW(18 clicks + addition).
Standards
| GoAhead | PutAway | GAPA | |
| Poor: | <40% | 10 ~ 15% | >55% |
| Below Average: | 40 ~ 45% | 15 ~ 20% | 55 ~ 65% |
| Average: | 45 ~ 50% | 20% | 65 ~ 70% |
| Above Average: | 50 ~ 55% | 20 ~ 25% | 70 ~ 80% |
| Great: | >55% | 25 ~ 30% | 80 ~ 90% |
xK%
Since there’s a linear relationship between GAPA and K%, slightly adjusting the formula gives us a 1:1 conversion: xK%.
2015 – 2021 formula: GAPA x 0.916 – 38.91
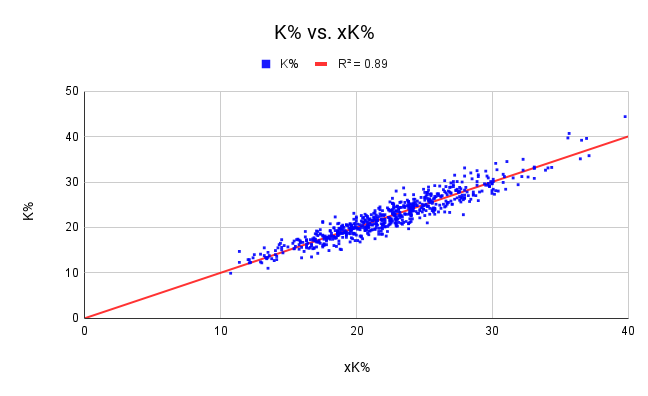
Trendline hitting 0:0 is always beautiful.
The Complete Formula
xK% = (GoAhead% + PutAway%) x 0.916 – 38.91
Standards
The standards for xK% are obviously the same as K%. And unlike GAPA, xK% is a lot more intuitive.
xK% is a good indicator of how much the pitcher could be striking out.
| Poor: | >15% |
| Below Average: | 15 ~ 20% |
| Average: | 20 ~ 25% |
| Above Average: | 25 ~ 30% |
| Great: | 30 ~ 35% |
| Amazing: | > 35% |
xK% Overperformers & Underperformers
(2015 – 2021)
| Overperform (K% > xK%) | Underperform (K% < xK%) |
| 1. Cristian Javier (5.2%) | 1. Pat Neshek (-5.1%) |
| 2. José Leclerc (5.1%) | 2. José Urquidy (-4.2%) |
| 3. Justin Anderson (5.1%) | 3. Mike Morin (-4.1%) |
| 4. Craig Kimbrel (5.0%) | 4. Adam Cimber (-4.1%) |
| 5. Josh Hader (4.6%) | 5. Cole Irvin (-3.9%) |
| 6. Matt Barnes (4.3%) | 6. Bartolo Colon (-3.8%) |
| 7. Aroldis Chapman (4.1%) | 7. Phil Hughes (-3.6%) |
| 8. John Axford (3.9%) | 8. Andrew Kittredge (-3.6%) |
| 9. Josh James (3.9%) | 9. Alex Claudio (-3.5%) |
| 10. Jason Grilli (3.8%) | 10. Mike Mikolas (-3.4%) |
The list is almost unsurprising, as we’ve seen those names often on the Strikeout rankings charts(high or low).
One possible explanation for the difference might be that some pitchers allow more contact with 2 strikes thus having fewer strikeout opportunities.
Predictive Power
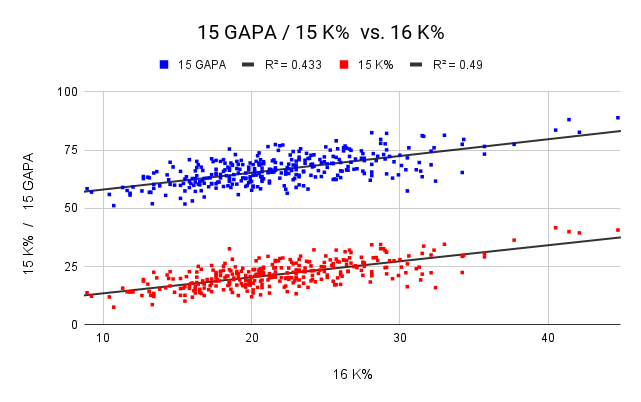
We can find that GAPA(xK%) is no more than a worse version of K% when it comes to predictive power; 2015 GAPA correlated with 2016 K% worse than 2015 K%.
Therefore, it isn’t an effective way to predict future performance, but a way to describe how a pitcher can/cannot strike hitters out.
Leaderboards
(2015 – 2021)
GoAhead% Leaderboard
| 1. Kenley Jansen | 57.2% |
| 2. Josh Hader | 56.2% |
| 3. Koji Uehara | 55.6% |
| 4. Max Scherzer | 55.5% |
| 5. Giovanny Gallegos | 55.5% |
| 6. Pat Neshek | 55.2% |
| 7. Seunghwan Oh | 55.1% |
| 8. John Brebbia | 54.9% |
| 9. Sean Doolittle | 54.5% |
| 10. Darren O’Day | 54.2% |
PutAway% Leaderboard
| 1. Betances, Dellin | 31.2% |
| 2. Josh Hader | 29.7% |
| 3. Andrew Miller | 29.3% |
| 4. Edwin Diaz | 28.7% |
| 5. Aroldis Chapman | 28.5% |
| 6. Corbin Burnes | 28.4% |
| 7. Shohei Ohtani | 28.2% |
| 8. José Fernández | 27.9% |
| 9. Craig Kimbrel | 27.8% |
| 10. Ken Giles | 27.5% |
You can find Full Leaderboards(SP/BP, Year) here.
Standout Pitchers
High GoAhead & Low PutAway
(2015-2021)
| 1. Pat Neshek | 37.5% |
| 2. Christian Bergman | 37.0% |
| 3. Seunghwan Oh | 36.5% |
| 4. Jason motte | 35.9% |
| 5. Miles Mikolas | 35.6% |
| 6. José Urquidy | 35.6% |
| 7. Matt Belisle | 35.3% |
| 8. Casey Fien | 35.1% |
These pitchers have had GoAhead% – PutAway% higher than 35%, which means that they got ahead very well, but not striking hitters out.
Most notably, Pat Neshek had merely an average K%(22.8) with the 7th highest GoAhead%(55.2) in MLB.
He had a 17.7% PutAway rate(bottom 1/3) while also underperforming xK% by -5.1%.
Christian Bergman’s PutAway rate was 12.1%(5th lowest) while having an average GoAhead%(49.1). That puts him at the 26th-lowest K%.
On the other hand, Chad Green’s 10th-highest GoAhead%(54.2) allowed him to have the 17th-best K% with an average PutAway%
Low GoAhead & High PutAway
(2015-2021)
| 1. Marc Rzepczynski | 16.5% |
| 2. Framber Valdez | 18.0% |
| 3. Shohei Ohtani | 18.2% |
| 4. Tanner Scott | 19.2% |
| 5. Clay Holmes | 19.3% |
| 6. Jace Fry | 19.7% |
These pitchers have had GoAhead% – PutAway% lower than 20%, which means that they struck out hitters well, but struggled to get to 2 strikes.
Most notably, Marc Rzepczynski had the lowest GoAhead%(40.4) in MLB with a 92nd-percentile PutAway%(23.9). That gives him an average K%.
On the other hand, Tanner Scott’s 11th-highest PutAway rate(27.2%) takes his average GoAhead%(46.4) into rank-35 of K%(30.7)
GBLG: Explaining BB% With Depth
Here’s a BB% version of GAPA.
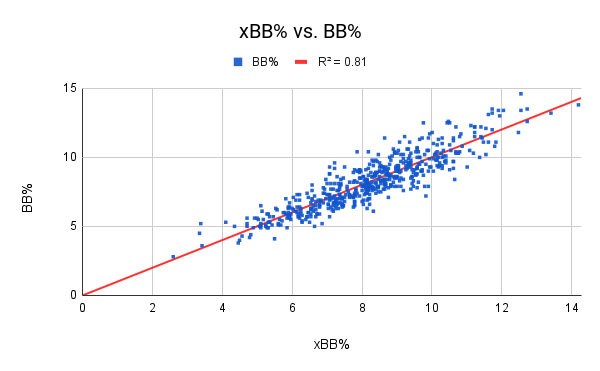
GBLG is a simple & effective look into “what makes a walk?”
It correlates with BB% with an r^2 of 0.81
Zone% / Ball%
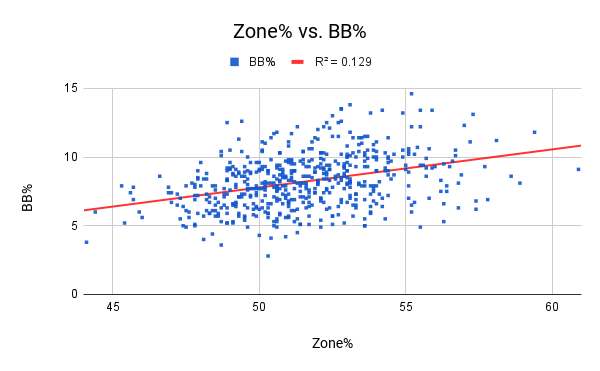
Zone% and Ball% are the most common indicators for walks.
Zone% doesn’t correlate well with BB%(r^2 = 0.129); pitchers with better control don’t necessarily throw inside the zone more often, nor are they necessarily balls.
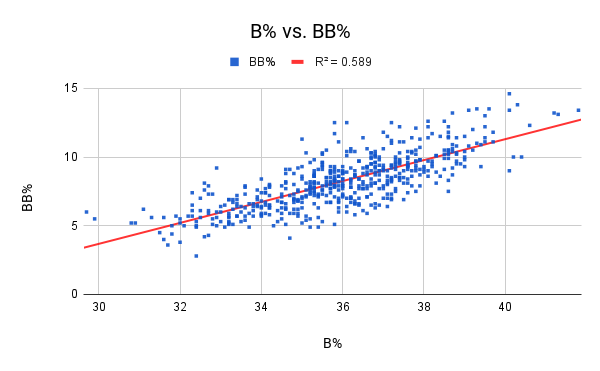
Ball% does correlate significantly(r^2 = 0.589); more balls lead to more walks, obviously.
Now, Balls hold different leverages in different counts, so they’re divided into 2 parts:
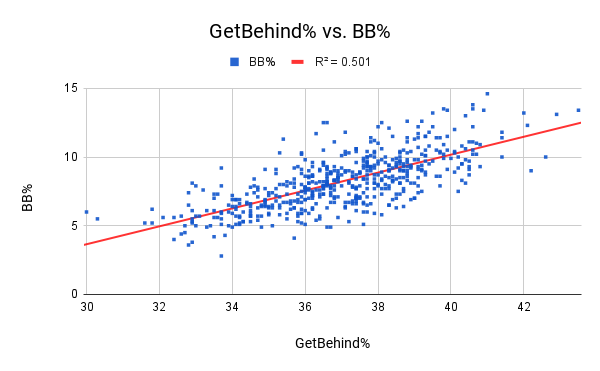
GBLG: GetBehind% + LetGo%
GetBehind% is Ball% with less than 3 balls.
LetGo% is Ball% with 3 balls.
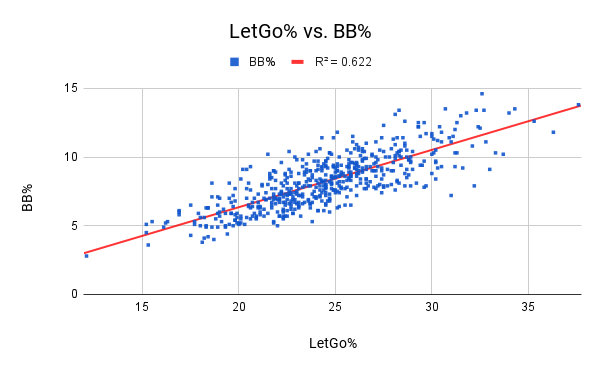
On their own, they’re not too impressive, especially compared to the generic Ball%.
Combine them together, and:
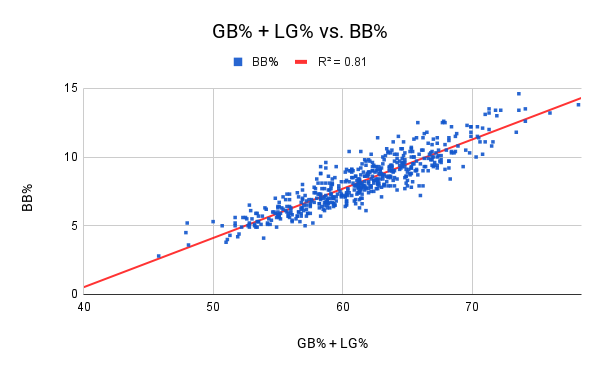
Voila.
GAPA posts an impressive r^2 of 0.89, essentially leaving out only specific count-leverages(perhaps something else).
Indeed, it takes a bit more work than B%(17 clicks + addition), which only takes 4 clicks.
Standards
| GetBehind | LetGo | GBLG | |
| Poor: | >40% | >35% | >75% |
| Below Average: | 37.5 ~ 40% | 25 ~ 35% | 60 ~ 70% |
| Average: | 35 ~ 37.5% | 25% | 60% |
| Above Average: | 32.5 ~ 35% | 15 ~ 25% | 50 ~ 60% |
| Great: | <32.5% | <15% | <50% |
xBB%
Since there’s a linear relationship between GBLG and BB%, slightly adjusting the formula gives us a 1:1 conversion: xBB%.
2015 – 2021 formula: GBLG x 0.358 – 13.8
Trendline hitting 0:0 is always beautiful.
The Complete Formula
xBB% = (GetBehind% + LetGo%) x 0.358 – 13.8
Standards
The standards for xBB% are obviously the same as BB%.
xBB% is a good indicator of how much the pitcher could be walking hitters.
| Poor: | >12.5% |
| Below Average: | 10 ~ 12.5% |
| Average: | 7.5 ~ 10% |
| Above Average: | 5 ~ 7.5% |
| Great: | <5% |
xBB% Overperformers & Underperformers
(2015-2021)
| Overperform (BB% < xBB%) | Underperform (BB% > xBB%) |
| 1. Sam Dyson (-2.6%) | 1. Antonio Bastardo (2.8%) |
| 2. Drew VerHagen (-2.3%) | 2. Trevor Rosenthal (2.7%) |
| 3. Brett Anderson (-2.2%) | 3. Jason Grilli (2.5%) |
| 4. Alec Mills (-2.0%) | 4. Neftali Feliz (2.4%) |
| 5. Brandon McCarthy (-1.9%) | 5. Daniel Ponce de Leon (2.3%) |
| 6. Jakob Junis (-1.8%) | 6. Ian Krol (2.2%) |
| 7. Yusei Kikuchi (-1.8%) | 7. Corey Knebel (2.2%) |
| 8. Derek Law (-1.7%) | 8. Jake Diekman (2.1%) |
| 9. Dereck Rodriquez (-1.7%) | 9. Kyle Crick (2.1%) |
| 10. Iván Nova (-1.7%) | 10. José Leclerc (2.1%) |
Predictive Power
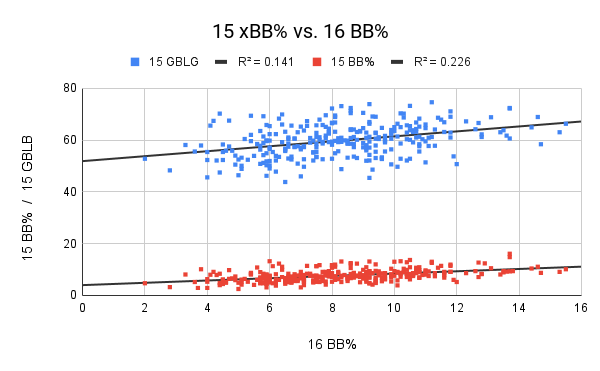
Like GAPA, GBLG(xBB%) is no more than a worse version of BB% when it comes to predictive power; 2015 xBB% correlated with 2016 BB% worse than 2015 BB%.
Therefore, it isn’t an effective way to predict future performance, but a way to describe how a pitcher walks hitters.
Leaderboards
(2015-2021)
GetBehind% Leaderboard
| 1. Kenley Jansen | 30% |
| 2. Sean Doolittle | 30.3% |
| 3. Nick Vincent | 31.6% |
| 4. Joe Smith | 31.8% |
| 5. Addison Reed | 31.8% |
| 6. Max Scherzer | 32.1% |
| 7. Bartolo Colon | 32.4% |
| 8. Shawn Kelley | 32.4% |
| 9. Joe Musgrove | 32.6% |
| 10. Clayton Kershaw | 32.6% |
LetGo% Leaderboard
| 1. Josh Tomlin | 12.1% |
| 2. Roberto Osuna | 15.2% |
| 3. John Means | 15.2% |
| 4. Miles Mikolas | 15.3% |
| 5. Liam Hendriks | 15.5% |
| 6. Dan Haren | 16.1% |
| 7. Addison Reed | 16.2% |
| 8. Tommy Milone | 16.3% |
| 9. Chad Green | 16.9% |
| 10. Deolis Guerra | 16.9% |
You can find the Full Leaderboard(By Year) here.
Standout Pitchers
High GetBehind & Low LetGo
(2015-2021)
| 1. John Means | 22.4% |
| 2. Adam Warren | 21.8% |
| 3. Josh Tomlin | 21.6% |
| 4. Josh Collmenter | 21.2% |
These pitchers have had GetBehind% – LetGo% higher than 21%, which means that they got behind a lot, but didn’t walk many hitters.
Adam Warren is the best example, as his 5th-percentile GetBehind rate(40.4%) is covered by his 95th-percentile LetGo rate(18.6%), making his BB% about average(8.1)
Low GetBehind & High LetGo
(2015-2021)
| 1. Greg Holland | 0.8% |
| 2. Brandon McCarthy | 1.5% |
| 3. Sandy Alcantara | 1.9% |
| 4. Arodys Vizcaíno | 2% |
| 5. Clay Holmes | 3% |
| 6. Lou Trivino | 3.4% |
| 7. Gregory Soto | 3.5% |
These pitchers have had GetBehind% – LetGo% lower than 4%, which means that they didn’t get behind often, and when they did, they walked a lot of hitters.
Most notably, Arodys Vizcaino had a below-average BB%(10.3) despite having a low GetBehind%(35.3, top-1/4) due to his 7th-highest LetGo rate(33.3%).
In the meanwhile, Kenley Jansen’s GetBehind%(30, lowest in MLB) allowed him to have a low walk rate(6%) with an average LetGo%(29.7).
Biggest K% Dropper/Riser (2020-21)
(min.250 pitches)
Riser
As of August, the no.1 riser goes to Dustin May, who’s had a big increase in the PutAway rate.
- K%: 19.6 -> 38.0
- GAPA: 66.2% -> 82.6%
- GoAhead%: 49.6 -> 52.4
- PutAway%: 16.6 -> 30.2
Dropper
The no.1 dropper goes to Tanner Rainey, who completely lost the ability to PutAway hitters this year(55% decrease)
- K%: 43.2 -> 24.6
- GAPA: 88.9% -> 65.8%
- GoAhead%: 52.9 -> 49.7
- PutAway%: 36.0 -> 16.1